The European Union’s path towards sustainable food systems increasingly relies on clear and reliable sustainability labelling. The recent Joint Research Centre (JRC) report provides a detailed analysis of the current state of sustainability labelling in the EU, describing its role, challenges and impact on consumer choices and market trends.
1. Introduction
Creating supportive food environments is essential to promote sustainable diets in the EU. The Farm to Fork strategy, part of the European Green Deal, aims to drive the transition towards sustainable food systems. However, the lack of clear and reliable information on food products remains a significant barrier to consumer engagement. The JRC report highlights how sustainability labelling is a key tool to overcome this obstacle, although over-labelling and greenwashing practices risk undermining consumer trust.
2. Objective and scope of the report
The report seeks to provide a better understanding of the current state of sustainability labelling in the EU food market. The JRC analyses the uptake and characteristics of existing sustainability labels, the social and environmental impacts they cover and their overall reliability. The report also examines the life cycle stages involved in these labels, trends in their market uptake and their influence on the environmental impacts of the food system according to scientific knowledge.
3. Methodology
A global approach has been adopted to map and evaluate sustainability labelling across the EU. This involved analysing data from the Mintel Global New Products Database (GNPD), characterising labels and assessing their environmental and social impacts. The methodology also included a review of the scientific literature on the effects of sustainability labelling on the environmental impacts of the food system (Figure 1).
 Figure 1. Workflow and links between methods used and research questions.
3.1 Mapping of sustainability-related labels
Mintel’s GNPD was the main source to identify sustainability-related logos on food products. The report mapped 36.335 products, filtering relevant sustainability claims and logos and confirming their relevance through an online check. Scientific articles, logo inventories and the Ecolabel Index were used to complete the search for sustainability-related logos. (2)
3.2 General characterization
The labels have been characterized based on various criteria, including the sustainability dimensions covered, the verification methods and the geographical spread. This allowed for a detailed comparison of the labels and their presence on the market.
3.3 Evaluation
To assess the coverage of sustainability aspects by the labels and their methodological soundness, a two-step approach was used: an ad hoc evaluation framework was defined; secondly, the mapped and characterised labels were selected, based on specific objectives and agreed criteria, to be then evaluated against the criteria set within the framework. The evaluation focused on environmental and social criteria, with a specific assessment of the reliability of the labels.
4. The current state of sustainability labelling in the EU
Sustainability labelling is increasing in the EU, with around 20% of new food products launched in 2021 featuring such labels. However, this uptake varies significantly across Member States and product categories. Environmental claims dominate the labelling landscape, while social claims are less widespread. (3)
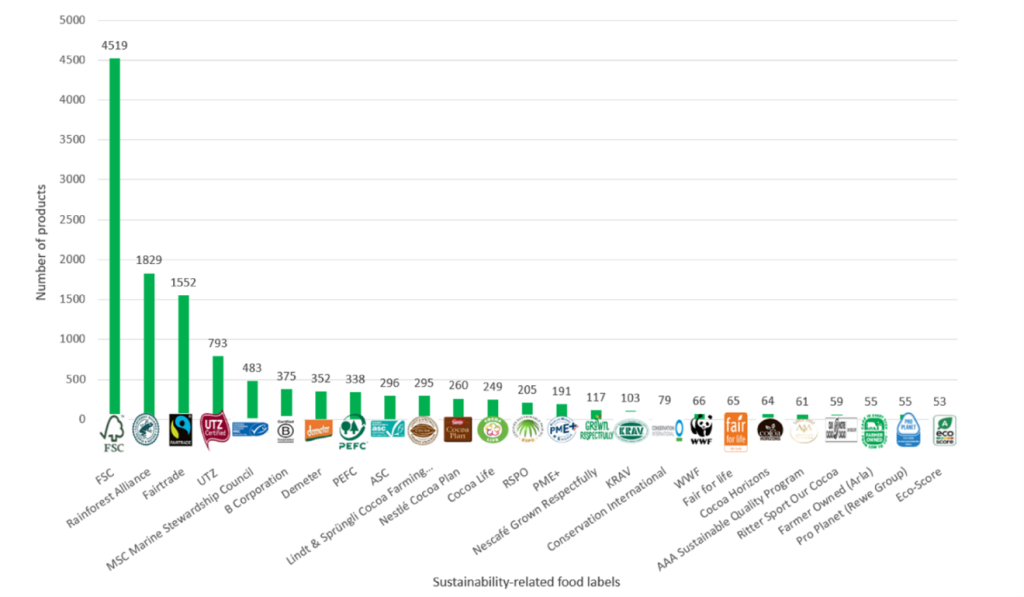
Figure 2. Number of products launched in the EU in 2021 with the top 25 sustainability-related food labels covering both environmental and social aspects (total launches = 74.420)
The distribution of labelling adoption is clearly oriented towards certain labelling schemes. For example, the top 5 labelling schemes covering both environmental and social sustainability aspects accounted for 81% (n=9.176; total=11.351) of category adoption.
Particularly, the Forest Stewardship Council (FSC) label, which covers only food packaging, was the most widely displayed in food product launches (n=4.519), contributing to 40% of adoptions among those covering both environmental and social sustainability, 32% of total sustainability label adoptions, and 6% of total new product launches (4.519 products out of a total of 74.420 products launched). It was followed by Rainforest Alliance (n=1.829, 2,4%), Fairtrade (n=1.552, 2%) and UTZ (n=793, 1,1%) (Figure 2).
5. Social aspects
Coverage of social aspects from sustainability labels is varied.
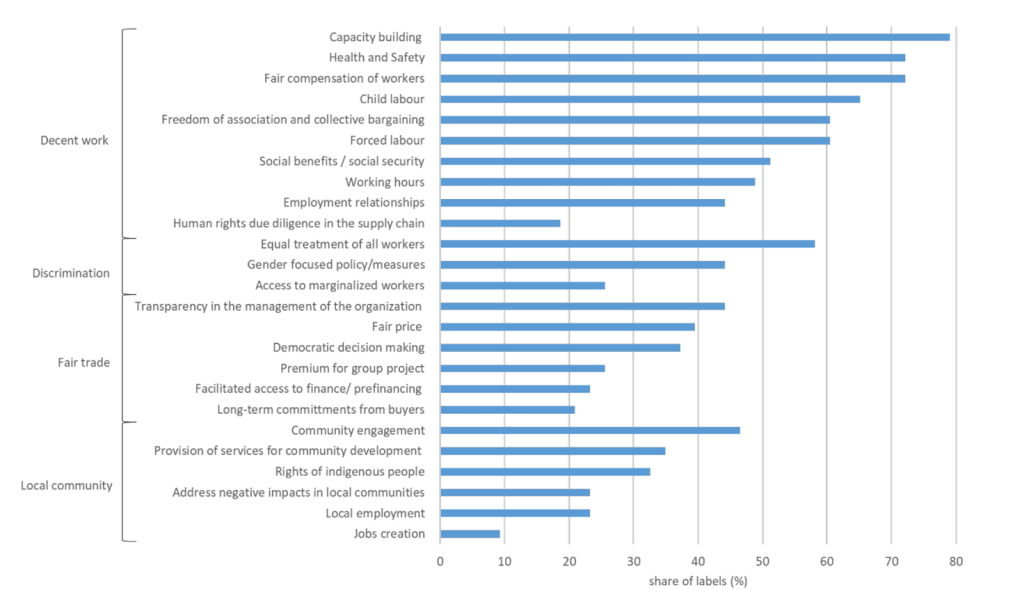
Figure 3. Percentage of evaluated labels (%) addressing social aspects included in the full sustainability label evaluation.
The working conditions dignity and non-discrimination are among the most frequently addressed issues, while fair trade and community support are less present. Animal welfare labels, although not fully assessed, are also present on the market and focus on various aspects of welfare along the supply chain (Figure 3).
6. Environmental impacts
The environmental impacts covered sustainability labels vary greatly. Labels commonly cover issues related to climate change, biodiversity loss, and land use, while impacts such as water use and soil health are less frequently addressed (Figure 4).
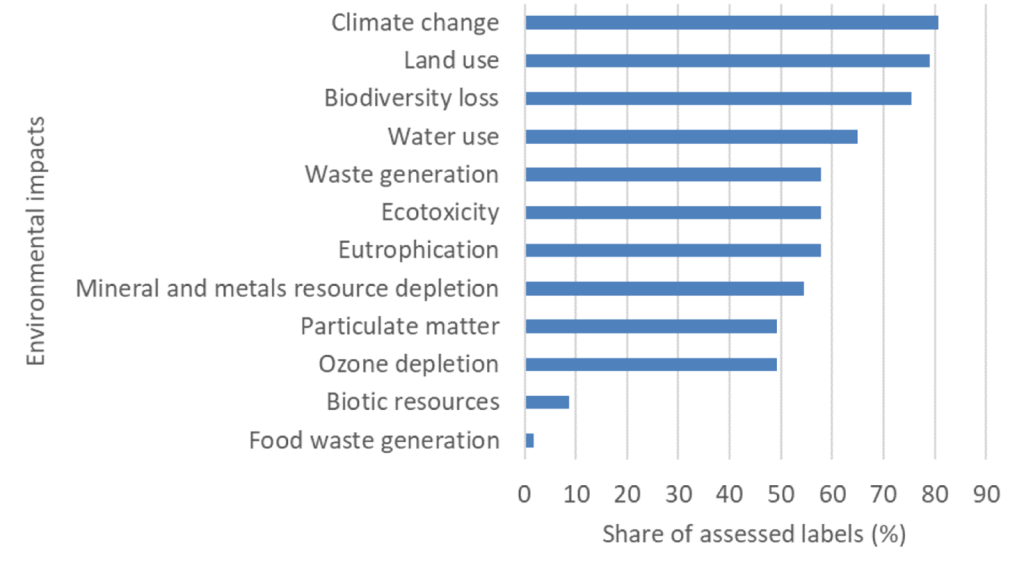 Figure 4. Percentage of evaluated labels (n=57) that address the environmental impacts considered
The report highlights the need for more comprehensive coverage of environmental impacts to improve the effectiveness of sustainability labelling.
7. Life cycle phases and operators
Implementation of sustainability labelling focuses on primary producers, with less involvement of other actors in the food chain (Figure 5). This finding is in line with the fact that primary production is the focal point of the total environmental impact for most food product groups (4).
 Figure 5. Number of labels involving life cycle stages in achieving label requirements
However, this concentration may limit the overall effectiveness of sustainability initiatives, highlighting the need for broader engagement across all life cycle stages.
8. Market trends
The market for products with sustainability labelling has grown steadily over the last decade, with significant increases in some Member States (NL, DE, BE, AT, EU, DK, SE) and in product categories such as hot drinks (coffee, tea), ready-to-drink products (coffee and tea products) and chocolate confectionery (Figure 6).
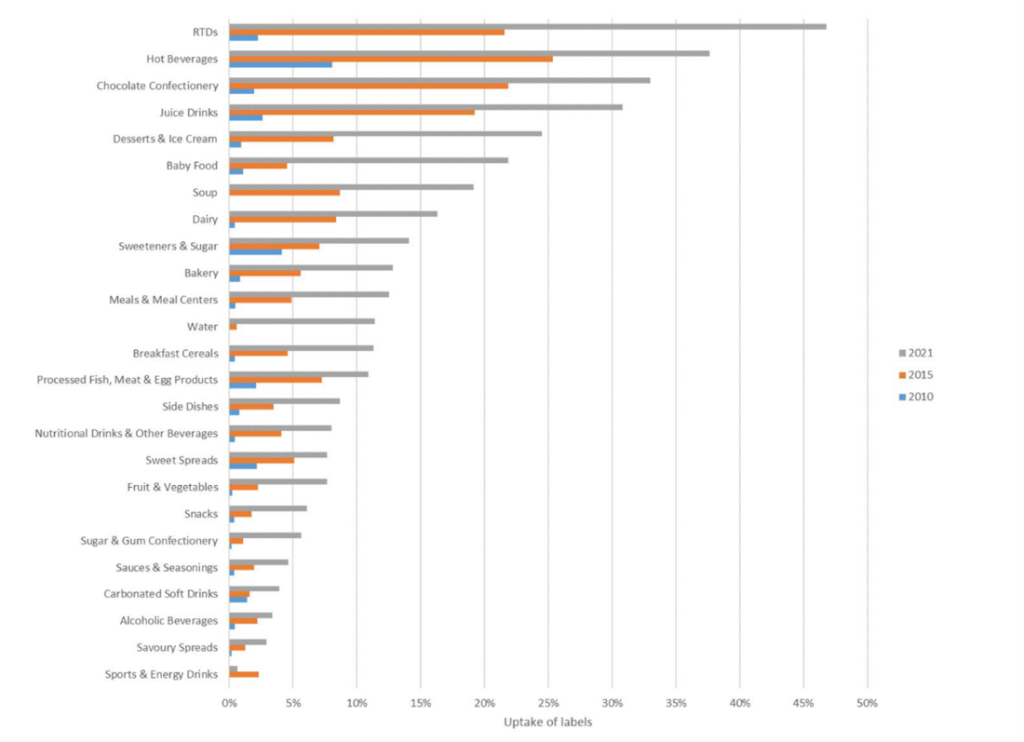 Figure 6. Evolution of the adoption of labels in new products for the period evaluated (2010, 2015, 2021) divided by food categories
Labels as the Forest Stewardship Council (FSC) and Rainforest Alliance dominate the market, reflecting a broader trend toward environmental certification in the food industry.
9. Reliability of sustainability labels
The reliability of sustainability labels is essential to maintain consumer trust. The report notes that while some labels demonstrate high reliability, others are less robust (5), lacking transparency and comprehensive assessment methods. This variability underscores the importance of ongoing efforts to standardize sustainability claims and improve the credibility of labelling systems (Table 1).
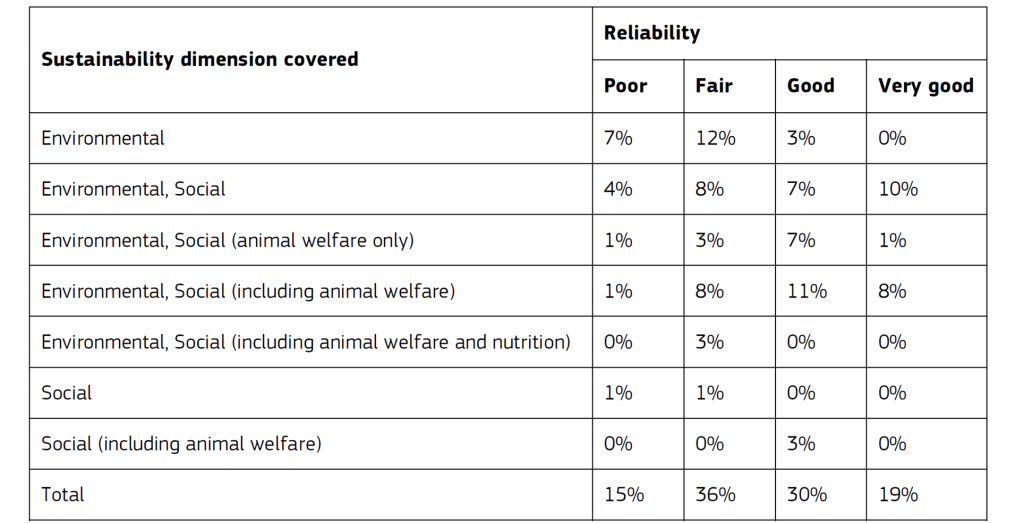 Table 1. Evolution of the adoption of labels in new products for the period evaluated (2010, 2015, 2021), divided by food categories
10. Expected effects on environmental impacts
Scientific evidence on the effectiveness of sustainability labels in reducing environmental impacts are still limited. Although some positive effects have been observed, the overall impact of these labels remains uncertain.
The main environmental impacts identified as relevant to the food system were:
- climate change,
- loss of biodiversity,
- land use,
- soil health and deforestation,
- water use and quality,
- waste production and food waste,
- overfishing,
- other environmental impacts.
The EFSA and ECDC’s One Health report calls for further research and improved methodologies to better assess the environmental benefits of sustainability labelling.
11. Limitations
The report acknowledges several limitations in its analysis, including the reliance on Mintel GNPD data, which only covers packaged products, and the difficulties in assessing the full range of environmental and social impacts of sustainability labels.
These limits highlight the need for more comprehensive data and methodologies in future studies.
12. Conclusions
The results highlight the high proliferation, the heterogeneity and inconsistencies of sustainability labels in the EU food market.
The research highlights how the large amount of different labels, with a heterogeneous and non-systematic coverage of environmental impacts, does not address environmental aspects horizontally nor use a systematic life cycle approach.
A similar image was found for labels that include the dimension of social sustainability.
The analysis also shows how actors in the food supply chain are not equally involved in the sustainability efforts required by labelling standards, thus generating compromises between food products and environmental and social issues.
The labels are implemented and distributed unevenly across EU Member States, with a few market-leading sustainability labels, meaning that a few labels cover a large share of labelled products. Furthermore, labelling is applied to a few food product categories (such as cocoa, oil palm, coffee, soy, sugar cane and fisheries), most of which are sourced outside the EU.
Sustainability labelling still has significant potential to promote positive changes in the EU food system. This could be done through harmonisation and standardisation of labels, increased transparency and more robust evaluation methods. The upcoming EU Green Claims initiative represents “a weak step in this direction” (6), with the aim of improving the reliability and effectiveness of sustainability labelling in the food sector.
Iudita Sampalean
Footnotes
(1) European Commission, Joint Research Centre, Sanye Mengual, E., Boschiero, M., Leite, J., Casonato, C., Fiorese, G., Mancini, L., Sinkko, T., Wollgast, J. , Listorti, G. and Sala, S., Sustainability labeling in the EU food sector: current status and coverage of sustainability aspects, Publications Office of the European Union, Luxembourg, 2024, https://data.europa.eu/doi/10.2760/90191, JRC134427.
(2) Environmental claims in the EU – European Commission Report https://www.qualenergia.it/wp-content/uploads/2023/01/Envclaims_inventory_2020_final_publi.pdf
(3) Dario Dongo, Marta Strinati. Environmental labelling, Planet-score debuts in France. GIFT (Great Italian Food Trade).
(4) Deconinck, K. & L. Toyama (2022). Environmental impacts along food supply chains: Methods, findings, and evidence gaps”, OECD Food, Agriculture and Fisheries Papers, No. 185, OECD Publishing, Paris, https://doi.org/10.1787/48232173-en
(5) Marta Strinati, Dario Dongo. Palm oil, soy, wood, coffee, cocoa. What is sustainability certification for? Greenpeace report. GIFT (Great Italian Food Trade). 16.05.21.
(6) Dario Dongo. Green Claims Directive, Brussels’ weak proposal against greenwashing. GIFT (Great Italian Food Trade).
Researcher, Ph.D in Marketing and Economics of the Agrifood System


